Description
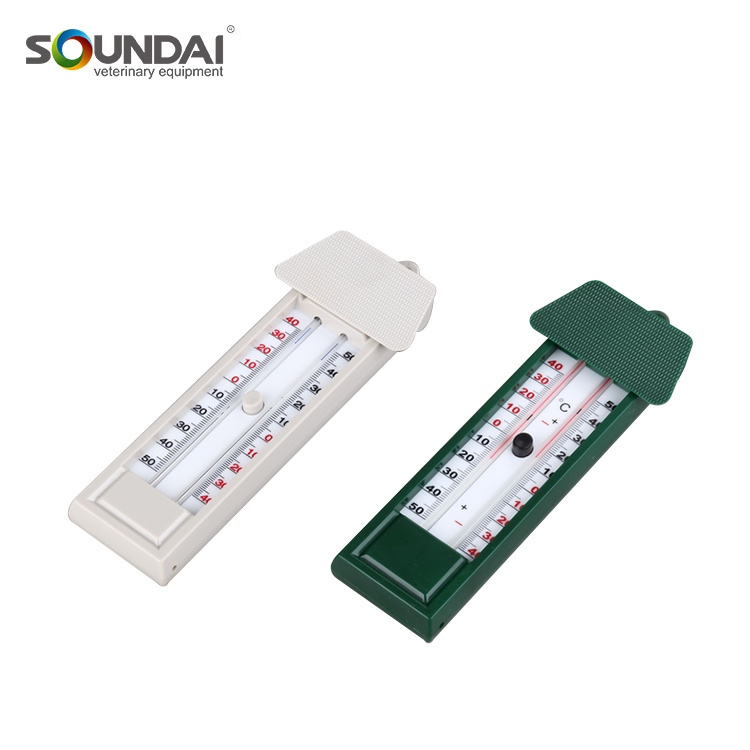
. This information is critical to maintaining optimal conditions for animals and poultry. In agricultural environments such as farms and poultry houses, charts of maximum and minimum temperatures help farmers and animal breeders monitor temperature fluctuations. This ensures that proper conditions are maintained to promote the health and well-being of the animals. It can make timely adjustments to heating or cooling systems, ventilation and other environmental controls. In addition, the graph can also be used for meteorological experiment teaching in schools and families. Students can observe and analyze temperature changes to understand weather patterns and scientific concepts related to climatology. It provides a hands-on approach to understanding temperature changes and their impact on the environment. To use the maximum and minimum temperature charts effectively, it is recommended to first press the button vertically, lowering the blue marker onto the mercury column inside the capillary bore. Placing the chart in a well-ventilated area will ensure accurate temperature measurements. It is important to observe the temperature for a specific duration and record the reading indicated by the lower end of the indicator needle. This data reflects the highest and lowest temperatures recorded during the observation period. Ensuring that the maximum and minimum temperature charts are properly maintained is critical to accurate and reliable measurements. Care should be taken to prevent any shock or impact that could cause the mercury column to detach. During transport and storage, charts should always be kept in a vertical position to maintain their functionality. Overall, the maximum and minimum temperature charts are an invaluable tool for animal habitat management and educational purposes. Its ability to record extreme temperatures provides valuable data for decision-making and scientific inquiry.
Package: Each piece with color box ,100 pieces with export carton.

